Intelligence & Reports
Two things live here. Conversation Intelligence reads and learns from every conversation automatically; the Reports workspace turns all that activity into dashboards, trends, and tables you can act on. Each report section has its own guide, explained in plain business terms with a short How it's calculated note for the detail.
Conversation Intelligence
Built-in tools that read and learn from every conversation automatically, no setup or manual tagging required. There are three parts, running across all your channels:
- Sentiment detection reads the emotional tone of each message, so you can see who is happy, frustrated, or needs urgent attention, and flags a customer the moment their tone shifts.
- Conversation memory automatically summarises each conversation when it ends and builds a growing profile of each customer, so any agent can pick up mid-thread fully prepared.
- AI quality scoring rates every AI reply on accuracy, tone, and helpfulness, flags weak replies for review, and shows quality trends over time.
What Reports is & who can use it
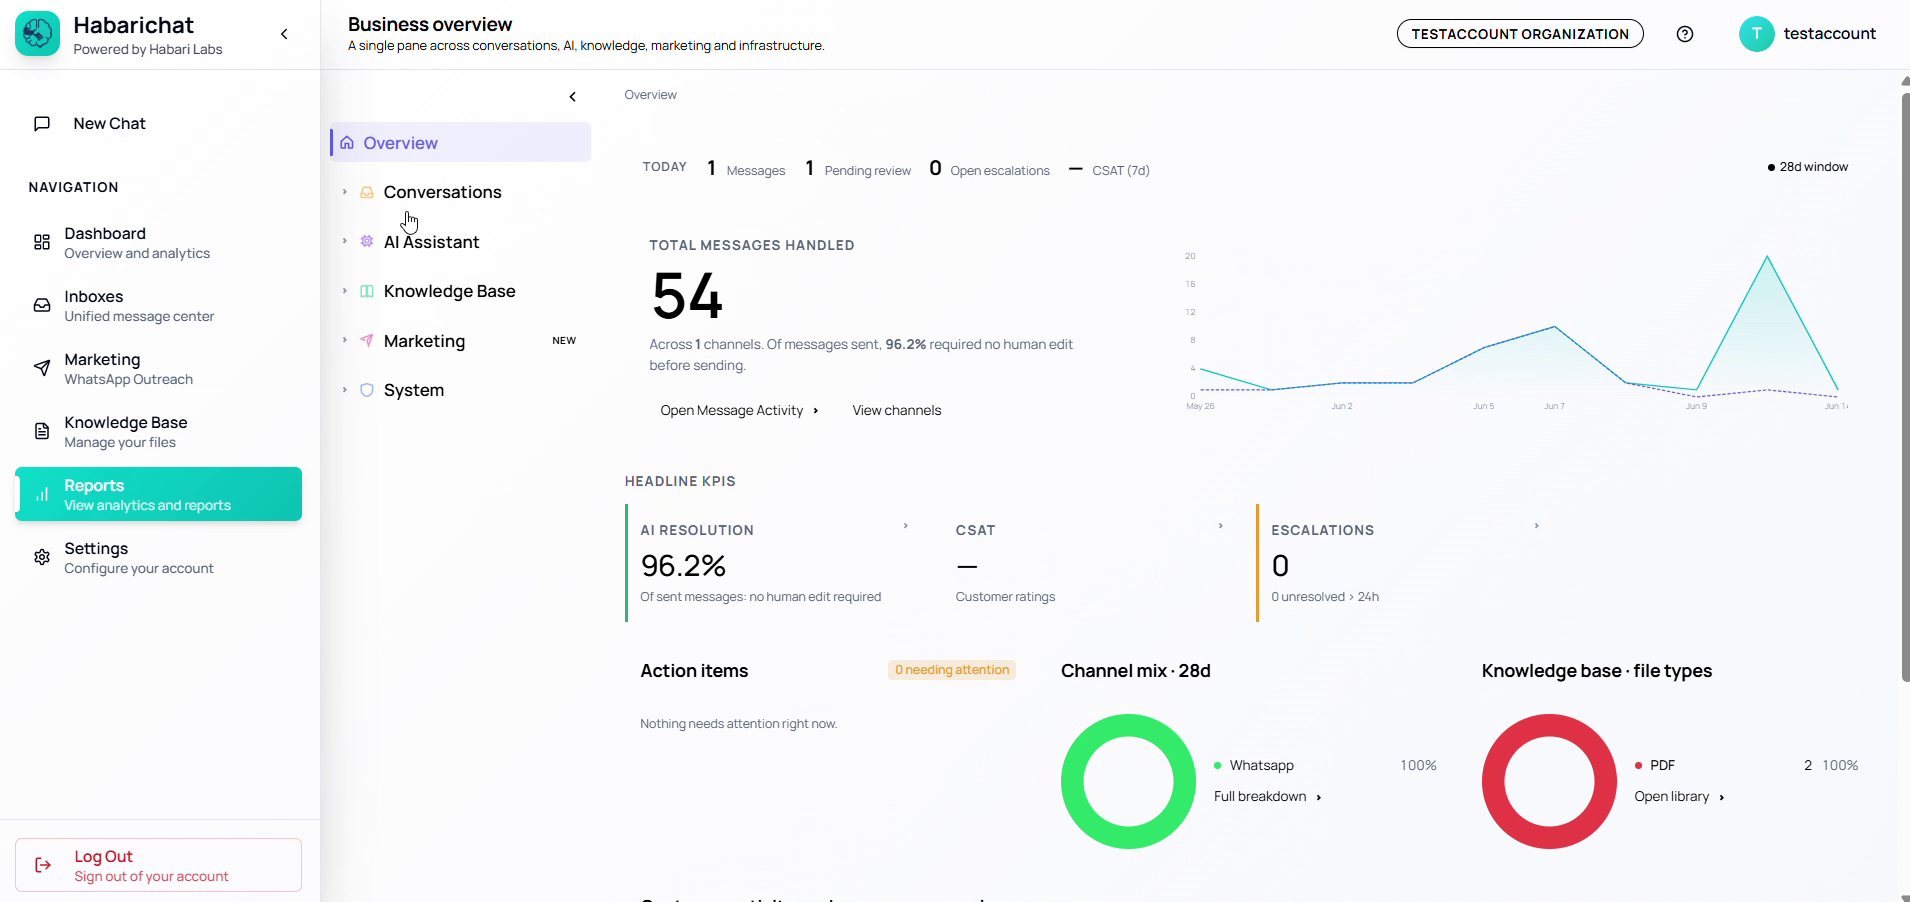
Reports is the analytics workspace for your organization. It collects activity from every connected inbox and channel and presents it as dashboards, trends, and tables, so you can answer questions like "Is the AI handling enough on its own?", "Are customers happy?", "Where is my team falling behind?", and "What is this costing me?"
Who can open Reports
- ✓ System Owners
- ✓ Organization Admins
- ✓ Individual users (single-user accounts)
- × Regular (non-admin) members, they won't see the Reports menu
If a teammate can't find Reports, it's almost always because their role doesn't include reporting access. An Organization Admin can adjust their role under Team Management.
How to read a report (shared concepts)
A handful of ideas appear again and again. Learn them once here.
AI resolution %
The share of your outgoing replies that the AI sent without a human editing them. High = the AI is doing the work on its own; low = your team is rewriting a lot of its drafts.
CSAT vs AI self-rating
Two different "quality" scores, don't confuse them. CSAT is your customers' satisfaction on a 1–5 scale, from ratings they submit. AI self-rating (also called AI confidence) is the AI grading its own answer, also 1–5, an early-warning signal, not customer opinion.
Escalations & the 24-hour SLA
An escalation is a conversation that left AI handling and needs a human. Any escalation still open beyond 24 hours is flagged as breaching SLA, so you can chase it.
Reply-time SLA & percentiles
Reply time is how long a customer waited for an answer. Because a few very slow replies distort an average, reports use the median (the middle value) and percentiles (e.g. p95 = "95% of replies were at least this fast").
SLA funnel, heatmaps & funnels
- SLA funnel, three bars showing the % of replies sent within 1 hour, 4 hours, and 24 hours.
- Heatmaps, a 7-days × 24-hours grid where darker cells mean more activity; great for spotting busy hours to staff or schedule campaigns.
- Funnels, a series of shrinking stages (e.g. Opened → AI replied → Resolved → Escalated) that show where conversations drop off.
Freshness buckets
Documents grouped by age: Current (updated in the last 7 days), Aging (8–30 days), Stale (older than 30 days). Stale documents may give the AI out-of-date answers.
Cost figures are estimates
AI/token costs are calculated from a fixed per-model price table, so treat them as close estimates for budgeting, not an invoice. Subscription billing uses your plan's currency (typically KES); WhatsApp messaging costs are in USD.
The report sections
Every report is grouped into sections. Each section has its own page, with each report explained in plain business terms and a short How it's calculated note. Jump to the area you need:
Overview
Your single-screen business summary: today's snapshot, totals, channel mix and auto-generated action items.
Open reportConversations
Message activity, channel performance, response quality, customer health, team reviews, escalations and CSAT.
Open reportAI Assistant
AI confidence scores, unanswered questions, AI ROI and the AI activity log.
Open reportKnowledge Base
Knowledge library, upload status and search quality for the documents the AI answers from.
Open reportMarketing
Campaign delivery, contacts and segments, message templates and messaging costs.
Open reportAcquisition New
Which ads and campaigns brought conversations that turned into orders, where you lose people, and why they didn't buy.
Open reportSystem
Account health, system status, plan and billing, team activity and historical data.
Open reportGlossary
Plain-language definitions of every term used across Reports.
Open glossaryReports FAQ
Common questions, empty charts, the date filter, and metrics still rolling out.
Open FAQ